


S-Curves & Bell Curves: I love this illustration because it shows how the two are related. The bell-curve shows the aggregate population at a point in time, while the s-curve shows how that population changes through time. We then have a slide that shows how we are moving through this process faster and faster.

Strategic inflection Point: The RIA industry is entering a “Strategic Inflection Point” and there is a lot of FUDD (Fear, Uncertainty, Denial, and Doubt). Each firm/individual needs to identify what they want, who they want to serve, and what they are willing to do to make it a reality. (this is what we help them do!)


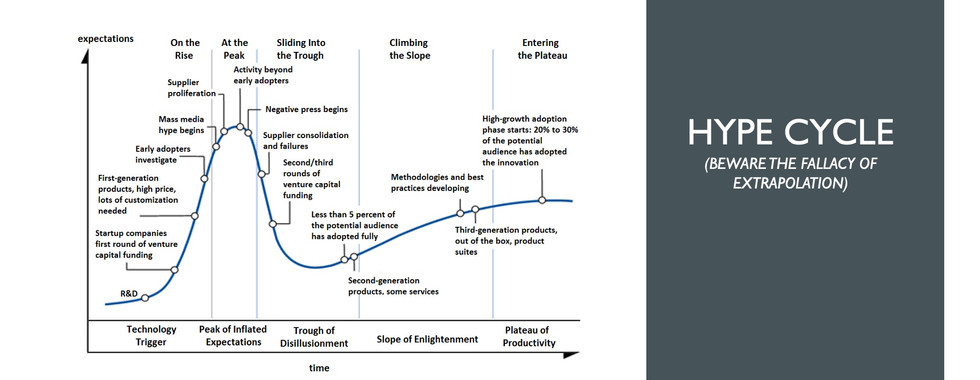
Bubbles & Hype Cycles: We want to help people identify the sustainable ones and stay away from the “bleeding edge”.
コメント